Cardiac Output Equation: Calculations and Pharm-D Notes
Learn CO = HR × SV, solve cardiac output and Fick calculations, and distinguish flow from pressure with practical Pharm-D examples and medicine cautions.
By Dr. Amina Rahman, PharmD12 min read
Reviewed by Medical Review Team ·
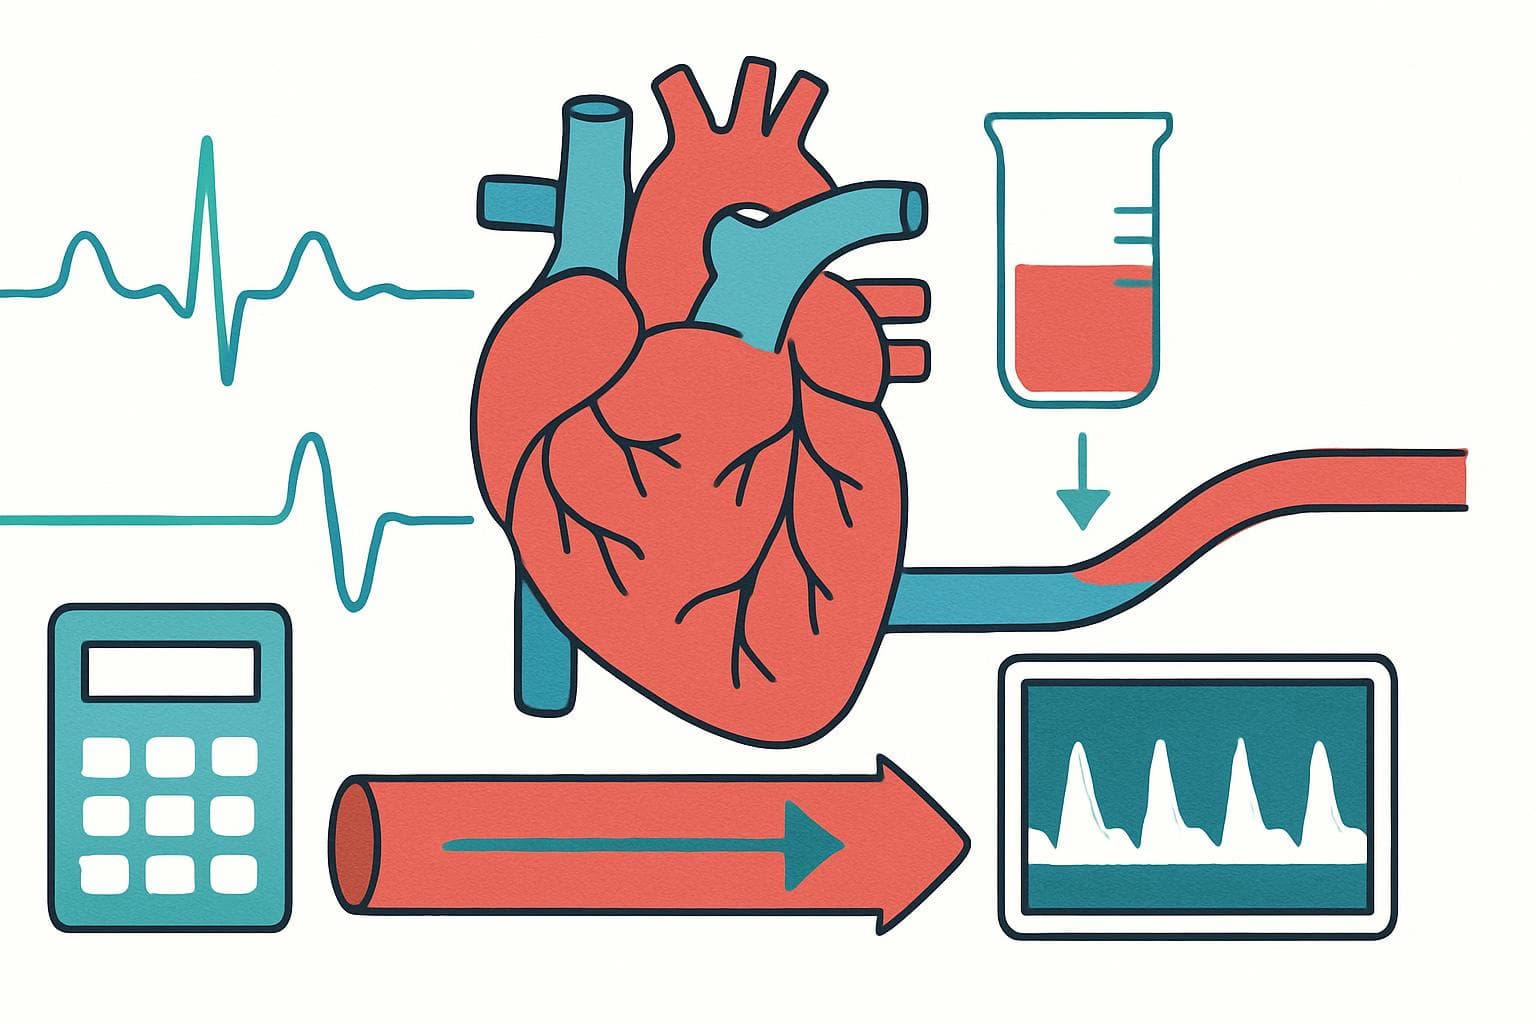
The cardiac output equation is CO = HR × SV, meaning cardiac output equals heart rate multiplied by stroke volume. If heart rate is 75 beats/min and stroke volume is 70 mL/beat, cardiac output is 5,250 mL/min, or 5.25 L/min.
This is blood flow, not blood pressure. For Pharm-D students and clinicians, the useful next step is understanding why a medicine can improve number while worsening another.
These notes are educational and do not advertise any company's product. Discuss medicine options with a pharmacist rather than choosing by brand or assuming that a higher cardiac output is always better.
Quick Answer / Overview
| Quantity | Equation | Usual reporting unit |
|---|---|---|
| Cardiac output | CO = HR × SV | L/min |
| Stroke volume | SV = CO ÷ HR | mL/beat |
| Heart rate | HR = CO ÷ SV | beats/min |
| Cardiac index | CI = CO ÷ body surface area | L/min/m² |
| Stroke volume from ventricular volumes | SV = EDV − ESV | mL/beat |
Convert units before rearranging. A cardiac output in litres cannot be divided by a stroke volume in millilitres without conversion.
Resting adult cardiac output is commonly about 4–8 L/min, but body size, activity, temperature, pregnancy, and illness affect interpretation. It is not a universal treatment target.
Key Definitions: What Each Variable Means
- Cardiac output (CO): the volume pumped by ventricle each minute. In steady circulation, average right- and left-ventricular outputs are essentially equal; do not add them together.
- Heart rate (HR): ventricular beats per minute. A peripheral pulse may undercount ventricular contractions when some beats produce little forward flow.
- Stroke volume (SV): blood ejected by a ventricle during beat.
- End-diastolic volume (EDV): blood inside the ventricle after filling, just before contraction.
- End-systolic volume (ESV): blood remaining after contraction.
- Ejection fraction (EF): the percentage of EDV ejected per beat, calculated as SV/EDV × 100.
- Cardiac index (CI): cardiac output adjusted for body surface area, allowing more meaningful comparisons between differently sized adults.
Keep flow and fraction separate. A normal ejection fraction does not prove that cardiac output is adequate, because a small, poorly filled ventricle can eject a normal percentage of a small volume.
Worked Calculations: Carry the Units Through
Example 1: Calculate output from rate and volume
A patient has HR 80 beats/min and SV 65 mL/beat:
CO = 80 × 65 = 5,200 mL/min = 5.2 L/min.
The beat units cancel. This dimensional check helps catch a missing conversion before the answer reaches a chart or examination paper.
Example 2: Derive stroke volume first
Suppose EDV is 120 mL and ESV is 50 mL:
SV = 120 − 50 = 70 mL/beat.
At HR 90 beats/min, CO is 90 × 70 = 6,300 mL/min, or 6.3 L/min. EF is 70/120 × 100, approximately 58%.
Example 3: Rearrange without a thousand-fold error
If CO is 4.8 L/min and HR is 80 beats/min:
SV = 4,800 mL/min ÷ 80 beats/min = 60 mL/beat.
Writing 4.8 ÷ 80 and labelling the result mL/beat would be wrong. That result is in litres per beat.
Example 4: Adjust for body size
For CO 5.4 L/min and body surface area 1.8 m²:
CI = 5.4 ÷ 1.8 = 3.0 L/min/m².
A commonly quoted resting adult CI range is approximately 2.5–4.0 L/min/m². Reference ranges vary, and a single value cannot diagnose poor tissue perfusion without clinical context.
STICKY NOTE — Write units first: Convert L to mL when needed, cancel matching units, and check whether the final magnitude makes physiological sense.
What Changes Heart Rate and Stroke Volume?
The multiplication is simple; its inputs interact. Raising heart rate increases output if stroke volume does not fall enough to cancel the gain.
Preload: Filling before contraction
Preload describes myocardial stretch before contraction, often related to end-diastolic volume. Venous return influences it, but a measured filling pressure is not the same as ventricular volume.
Within physiological limits, greater filling can increase contraction strength and stroke volume through the Frank–Starling mechanism. More fluid is not automatically better. In a failing or already congested heart, additional fluid may chiefly raise filling pressures rather than improve useful forward flow.
Afterload: The load opposing ejection
Afterload is the load the ventricle must overcome to eject blood. Systemic vascular resistance contributes to left-ventricular afterload, but arterial properties, ventricular geometry, and aortic valve obstruction also matter.
An abrupt increase in afterload can reduce stroke volume. Conversely, appropriate afterload reduction may improve forward flow even while blood pressure falls.
Contractility and rhythm
Contractility is the myocardium's intrinsic force-generating ability at a given loading condition. Sympathetic stimulation and some inotropes increase it; myocardial injury and certain medicines can reduce it.
Rhythm also matters. A very fast rate shortens filling time, while loss of coordinated atrial contraction may further impair filling in a stiff ventricle.
Venous return → ventricular filling → stroke volume
Contractility and afterload → modify stroke volume
Heart rate × stroke volume → cardiac output
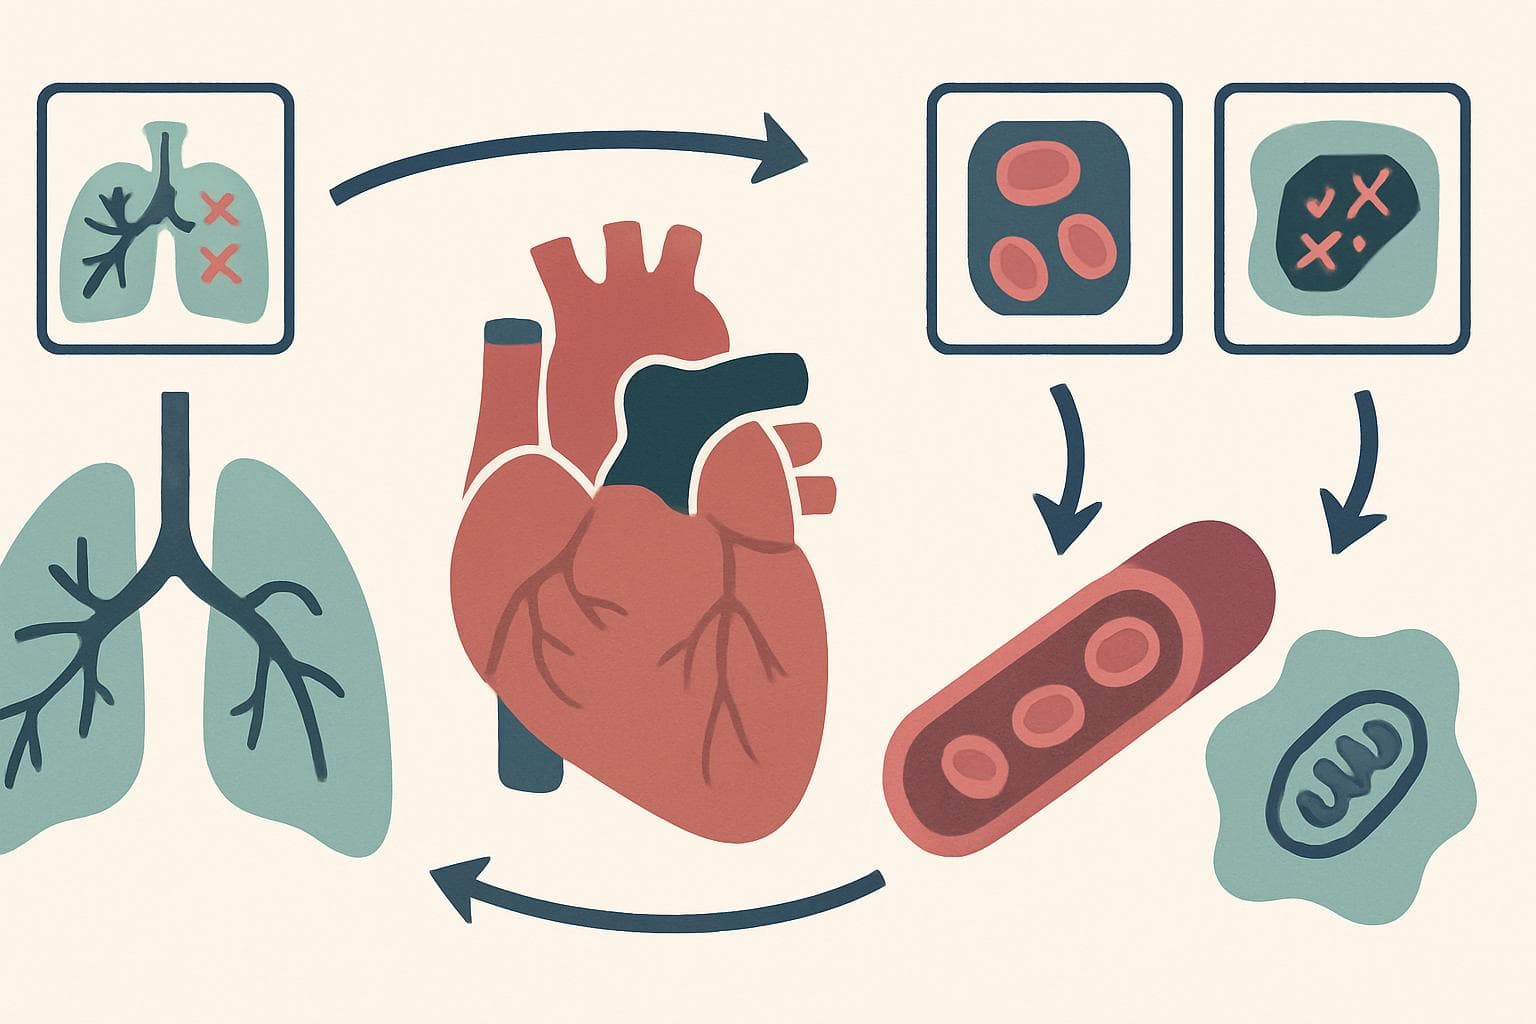
Cardiac output × arterial oxygen content → oxygen delivery
The Fick Equation: Calculate Flow from Oxygen Use
The Fick principle states that an organ's uptake of a substance equals blood flow multiplied by its arterial–venous concentration difference. For whole-body oxygen uptake:
CO = VO₂ ÷ (CaO₂ − CvO₂)
Here, VO₂ is oxygen consumption per minute, CaO₂ is arterial oxygen content, and CvO₂ is mixed venous oxygen content. Content means oxygen quantity per blood volume, not saturation percentage alone.
Consider VO₂ of 250 mL oxygen/min, CaO₂ of 200 mL oxygen/L blood, and CvO₂ of 150 mL oxygen/L blood:
CO = 250 ÷ (200 − 150) = 5 L/min.
Watch the denominator's units. If the same contents are written as 20 and 15 mL/dL, the answer is 50 dL/min, which still equals 5 L/min.
Direct Fick measurement uses measured oxygen consumption. Methods that substitute estimated oxygen consumption can introduce substantial error, particularly when metabolism differs from the assumptions used.
True mixed venous blood is generally sampled from the pulmonary artery. Central venous oxygen saturation is not automatically interchangeable with mixed venous saturation for precise calculations.
REMEMBER — Saturation is not content: A pulse oximeter cannot supply the complete Fick denominator, and a high saturation does not exclude low oxygen delivery in severe anemia.
How Cardiac Output Is Measured in Practice
The equation does not make stroke volume directly observable. Devices estimate or measure flow using different physical principles, so values from different methods may not be interchangeable.
| Method | Working principle | Practical limitation |
|---|---|---|
| Doppler echocardiography | Outflow tract area × velocity–time integral gives SV; multiply by HR | Alignment and diameter measurement affect accuracy |
| Thermodilution | Temperature change after indicator injection is used to calculate flow | Technique, significant tricuspid regurgitation, and shunts can affect results |
| Fick method | Oxygen consumption divided by arterial–mixed venous oxygen content difference | Estimated oxygen consumption and sampling errors can mislead |
| Pulse contour analysis | Arterial waveform characteristics estimate SV and CO | Accuracy depends on the device, calibration, rhythm, and vascular tone |
For Doppler calculations, the velocity–time integral (VTI) represents the distance blood travels during beat. Cross-sectional area in cm² multiplied by VTI in cm gives cm³, equivalent to mL.
A small diameter error matters. Because circular area depends on diameter squared, an inaccurate outflow tract diameter can disproportionately distort calculated stroke volume.
Cardiac Output, Blood Pressure, and Oxygen Delivery Differ
Three linked concepts often become muddled examination answer. Separate them deliberately.
| Concept | Question it answers | Why an apparently normal value can mislead |
|---|---|---|
| Cardiac output | How much blood flows each minute? | Adequate flow may carry insufficient oxygen when hemoglobin is low |
| Blood pressure | What pressure drives systemic circulation? | High vascular resistance can maintain pressure despite low flow |
| Ejection fraction | What fraction of ventricular filling is ejected? | Preserved EF can coexist with impaired filling and low SV |
The systemic pressure–flow relationship is approximately:
MAP − RAP = CO × SVR
MAP means mean arterial pressure, RAP means right atrial pressure, and SVR means systemic vascular resistance. This form requires compatible units, with SVR expressed in mmHg·min/L.
When SVR is reported in dyn·s/cm⁵:
SVR = 80 × (MAP − RAP) ÷ CO.
Do not omit the conversion factor. Also, BP alone cannot reveal output because vascular resistance changes independently.
Systemic oxygen delivery is DO₂ = CO × CaO₂ when units match. If CaO₂ is in mL oxygen/dL and CO is in L/min, multiply by 10 to obtain mL oxygen/min.
Pharmacy Practice: Interpret Medicine Effects, Not Just Pulse
Dobutamine, a beta-adrenergic inotrope, can increase contractility and output, but it may also cause tachycardia, arrhythmias, and greater myocardial oxygen demand. It requires monitored clinical use, not selection from an isolated CO result.
Noradrenaline (norepinephrine), a vasopressor, mainly raises vascular tone. Its effect on output varies with cardiac function, venous return, and afterload; a rise in blood pressure does not guarantee an equivalent rise in flow.
Bisoprolol, a beta blocker, slows heart rate. Although excessive slowing or acute negative inotropy can reduce output, appropriate long-term beta-blocker treatment benefits selected patients with heart failure. Do not translate the equation into an instruction to stop treatment.
Furosemide, a loop diuretic, reduces congestion. Excessive diuresis can reduce filling and cause hypotension, kidney dysfunction, or electrolyte disturbances, whereas relieving congestion can benefit an overloaded patient.
Glyceryl trinitrate (nitroglycerin), a nitrate vasodilator, changes loading conditions but can cause headache and hypotension. Its interaction with phosphodiesterase-5 inhibitors can produce dangerous hypotension.
Check the generic name and formulation. Different release formulations are not automatically interchangeable, and a calculated output is not a basis for changing tablets or titrating an infusion outside the prescribed protocol.
Confirm every medicine dose, formulation, and adjustment with the treating doctor or pharmacist. No dosing regimen can be derived safely from CO alone.
A Practical Interpretation Check Before Acting
First ask whether the inputs belong together. Multiplying today's resting pulse by a stroke volume measured yesterday during an infusion change may produce a precise-looking but clinically meaningless answer.
Document measurement timing, rhythm, method, oxygen support, and relevant treatment changes. In irregular rhythms, representative beat averaging is usually needed; unusually strong or weak beat may distort the estimate.
Check the patient next. Review consciousness, skin perfusion, urine output trends, blood pressure, congestion, and relevant laboratory findings rather than chasing monitor number.
For patients reading an echocardiography report, a smartwatch pulse cannot independently calculate output. Do not exercise harder, drink excessive fluid, or stop a beta blocker to push the calculated value upward.
Stop exertion and seek urgent assessment for new chest pain, fainting, severe breathlessness, or confusion. These symptoms matter more than a home calculation.
IMPORTANT — Match the measurement moment: Trend comparisons are strongest when the method and physiological conditions are comparable. An apparent treatment response may otherwise be a measurement difference.
Quick Pharm D Notes
- Definition: Cardiac output is ventricular blood volume pumped per minute.
- Core equation: CO = HR × SV; convert mL/min to L/min by dividing by 1,000.
- Determinants: Preload, afterload, contractility, heart rate, and rhythm influence output.
- Classification: Low-, normal-, and high-output states describe flow, not the underlying diagnosis.
- Examples: Exercise increases output; severe anemia or thyrotoxicosis can produce high-output states.
- Clinical significance: Inadequate effective flow can impair organ perfusion; high output is not always reassuring.
- Exam distinction: EF is a percentage, SV is a volume per beat, and CO is a volume per minute.
- Measurement point: Estimated values inherit errors from every input.
Common Mistakes and Confusions
Assuming that faster always means better misses the effect of shortened filling time. At sufficiently high rates, SV can fall enough to reduce output.
Calling every low BP reading low output ignores vascular resistance. Vasodilation can produce low pressure despite normal or increased flow.
Treating EDV − ESV as guaranteed forward systemic flow overlooks important valve disease. With substantial mitral regurgitation, part of the left ventricle's ejected volume travels backward rather than into the aorta.
Treating a reference range as a diagnosis also fails. Interpret the method, patient size, metabolic demand, and clinical findings together.
FAQ
What is the cardiac output equation?
CO = HR × SV. Multiply heart rate in beats/min by stroke volume in mL/beat to obtain mL/min, then divide by 1,000 for L/min.
What is a normal cardiac output?
A commonly cited resting adult range is about 4–8 L/min. Body size and physiological demand matter, so interpret it alongside cardiac index and clinical findings.
Can cardiac output be calculated from blood pressure alone?
No. The pressure–flow relationship also requires systemic vascular resistance and right atrial pressure; assuming those values can give a misleading estimate.
Does a normal ejection fraction mean normal cardiac output?
No. EF describes the fraction ejected, not the absolute volume delivered per minute. Impaired filling, valve disease, and heart rate can change the relationship.
Why does exercise increase cardiac output?
Working muscles need more oxygen. Heart rate and usually stroke volume rise through sympathetic activation and increased venous return, although their contributions vary with exercise intensity and fitness.
Can I use my pulse to calculate cardiac output at home?
Not accurately without stroke volume. Watches may estimate selected cardiovascular metrics, but pulse alone cannot establish cardiac output or justify medicine changes.
Last-Minute Revision
- CO = HR × SV.
- SV = EDV − ESV.
- EF = SV/EDV × 100.
- CI = CO/body surface area.
- Fick CO = VO₂/(CaO₂ − CvO₂).
- Carry units through every calculation.
- Pressure, flow, and oxygen delivery answer different questions.
- Treat the clinical problem, not an isolated calculated number.
References
- Hall and Hall. Guyton and Hall Textbook of Medical Physiology. Cardiac output, venous return, and circulatory regulation.
- Boron & Boulpaep Medical Physiology. Cardiovascular physiology and oxygen transport.
- Braunwald's Heart Disease: A Textbook of Cardiovascular Medicine. Hemodynamic assessment and cardiac function.
- Goodman & Gilman's The Pharmacological Basis of Therapeutics. Cardiovascular pharmacology.
Important Medical Disclaimer
This article is for general educational purposes and is not a substitute for advice from a qualified doctor or pharmacist. Always consult your doctor/pharmacist before using any medicine, changing a dose, or starting treatment.
Related reading
If this article on Cardiac Output Equation: Calculations and Pharm-D Notes was helpful, explore these related guides for more practical information on similar topics.
- Define Hypoxia in Detail: A Pharm-D Study Notes Guide — Understand hypoxia through oxygen delivery, its four major types, diagnostic clues and treatment principles, with practical Pharm-D revis…
- Shock: Types, Causes, Pathophysiology and Stages Explained — Shock: Types, Causes, Pathophysiology and Stages Explained (Complete Pharm D Notes) Introduction Shock is of the most important topic…
- Define Hemorrhage: Detailed Pharm-D Notes and Safety — Understand hemorrhage through classification, mechanisms, morphology, clinical signs, and medicine-related risks, with clear exam notes a…
- Neutrophils: Function, ANC and Clinical Pharm-D Notes — Understand neutrophil function, calculate ANC, and interpret high or low counts, with drug-related causes and urgent fever advice for cli…
- Define Edema in Detail: Mechanisms and Pharm-D Notes — Understand edema through fluid balance, clinical patterns, medicine-related causes, and treatment principles, with exam notes and urgent…
- Adverse Drug Reaction Reporting Systems — Pharmacovigilance fundamentals for students and practicing pharmacists.