Limit of Detection (LOD): Method of Determination Explained Simply
How Is the Limit of Detection (LOD) Actually Determined? When an analytical method is validated — an HPLC assay, a UV method, even a simple colour-based test — one question always comes up: how little of the substance
By Dr. Amina Rahman, PharmD6 min read
How Is the Limit of Detection (LOD) Actually Determined?
When an analytical method is validated — an HPLC assay, a UV method, even a simple colour-based test — question always comes up: how little of the substance can this method actually see? That "how little" has a formal name in pharmaceutical analysis: the Limit of Detection (LOD).
This note covers what LOD means, how it's determined according to ICH Q2(R2), and where students usually trip up on it.
What LOD Really Means
LOD is the smallest amount of an analyte in a sample that a method can pick up and confidently say "yes, something is here" — even if the method can't yet tell you exactly how much is there. Detecting and measuring are two different jobs, and LOD promises the first one.
A simple way to picture it: put a single drop of ink into a glass of water, and you might see the water tint slightly and know there's ink in it, without being able to say how many milligrams of dye you're looking at. That's detection. Measuring the exact amount is a separate, usually harder task — that's the job of the Limit of Quantitation (LOQ).
LOD Is Not LOQ
Students mix these up constantly, so it's worth stating plainly: LOD tells you the method can detect the analyte; LOQ tells you the method can measure it with acceptable accuracy and precision. LOQ concentrations are always higher than LOD concentrations for the same method, because reliable quantitation demands more signal than mere detection does.
| LOD | LOQ | |
|---|---|---|
| Question it answers | Can the method see this at all? | Can the method measure this reliably? |
| Common formula | 3.3σ/S | 10σ/S |
| Precision required | Not required | Required |
Three Ways ICH Q2(R2) Recognises for Determining LOD
ICH's guideline on validating analytical procedures doesn't insist on a single way to find LOD. It recognises three general approaches, and which fits depends on the type of method being validated.
1. Visual evaluation
The simplest approach, and it works for both non-instrumental techniques (TLC, colour-change tests) and instrumental ones. You prepare a series of samples with known, decreasing concentrations of the analyte, analyse them, and find the lowest concentration at which you can still reliably tell the analyte is present. That concentration is your LOD.
It's more of a judgement call than a calculation, but it's a legitimate, widely used approach — especially useful when the instrument doesn't give clean numerical output to build a calibration curve from.
2. Signal-to-noise ratio
This applies to methods that produce measurable baseline noise — chromatographic methods being the classic case. You run progressively lower concentrations and compare the height of the analyte's peak against the surrounding baseline noise. the peak is roughly three times the noise height (a signal-to-noise ratio of about 3:1, sometimes quoted as 2:1 depending on the source), you've found your LOD. Quantitation, for comparison, typically needs a ratio closer to 10:1.
This method is popular in HPLC and GC labs because most chromatography data systems calculate signal-to-noise ratios automatically.
3. Standard deviation of the response and slope of the calibration curve
This is the calculation-based method, and it's usually the Pharm D exams focus on because it gives a clean numerical answer:
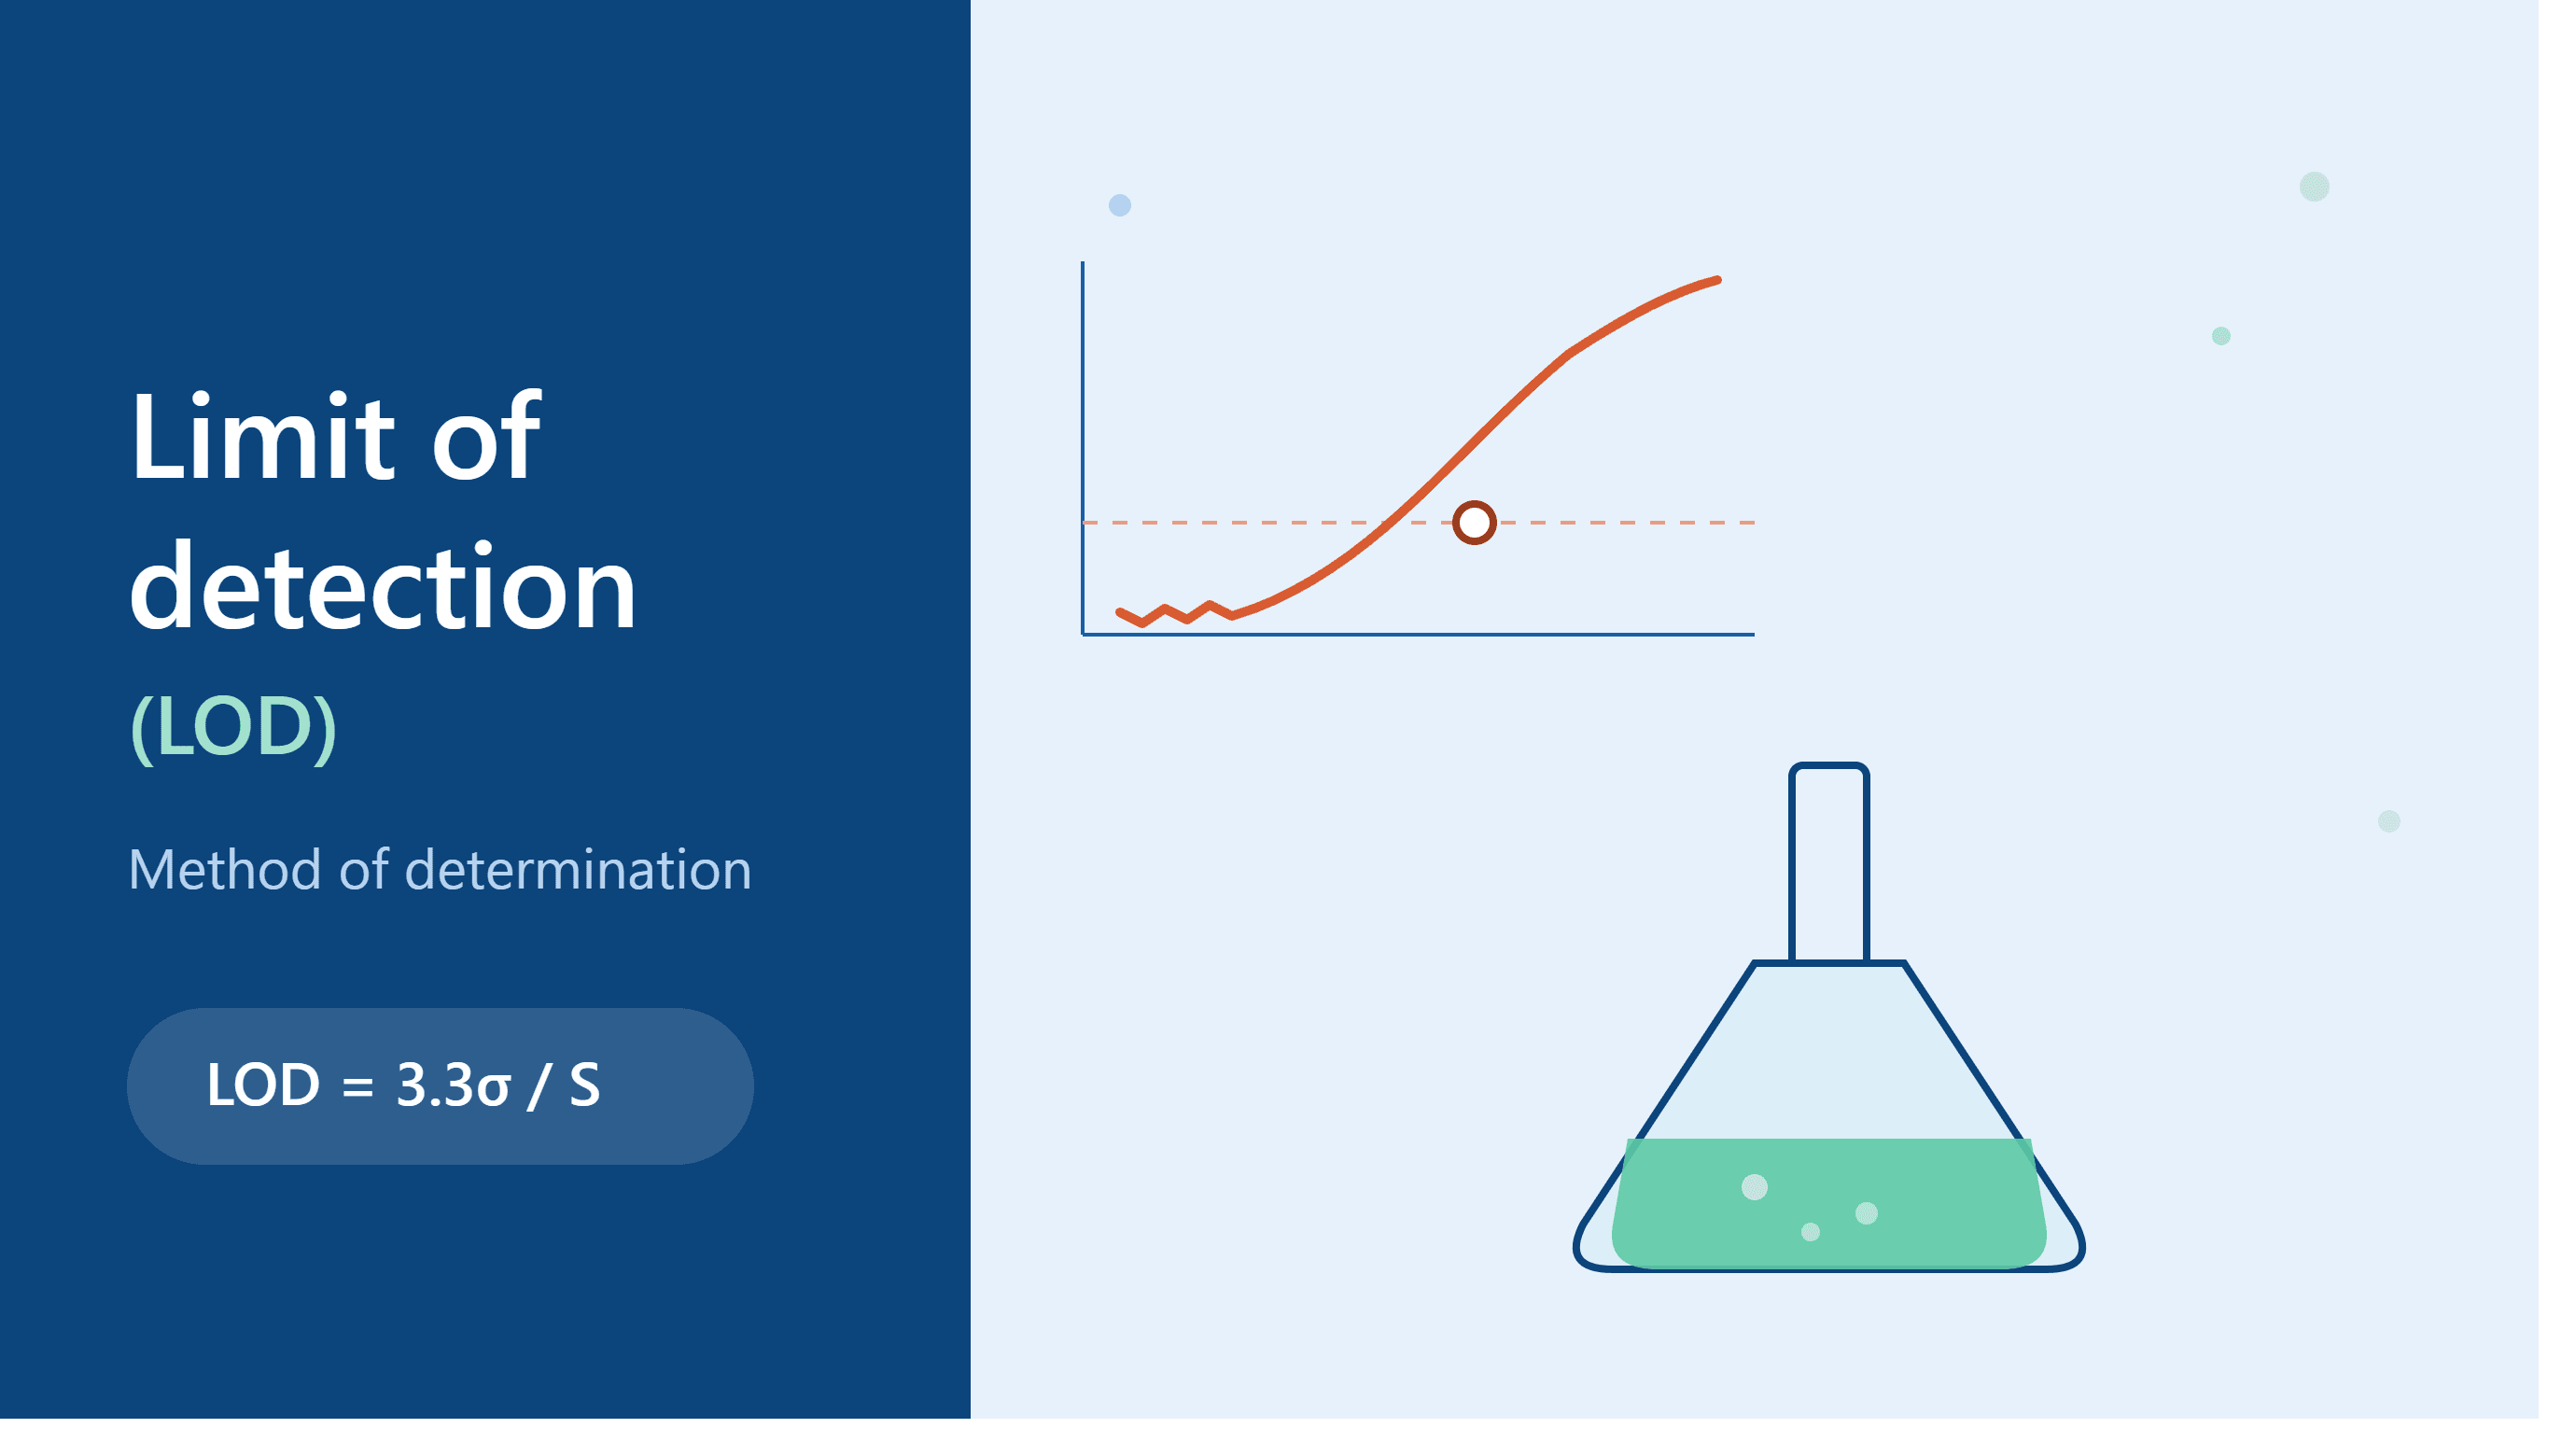
LOD = 3.3σ / S
- σ (sigma) is the standard deviation of the analytical response — a measure of background noise or scatter in the data.
- S is the slope of the calibration curve — how much the response changes per unit change in concentration.
The value 3.3 comes from the statistics of distinguishing a genuine signal from background noise at an acceptable confidence level, and it's the constant ICH has settled on for this purpose.
Getting σ and S in Practice
The slope, S, comes directly from the calibration curve. You prepare standard solutions across a suitable concentration range, run each through the method, and fit a straight line (y = Sx + b) to concentration versus response. The slope of that line is S.
Standard deviation is a little more flexible — ICH allows a couple of reasonable ways to estimate it:
- From blank measurements. Run a reasonable number of blank samples (matrix with no analyte) and calculate the standard deviation of their responses. This captures the system's background noise directly.
- From the calibration curve itself. Use the residual standard deviation of the regression line, or the standard deviation of the y-intercepts from several replicate calibration curves.
Neither method is "more correct" in general — the choice usually comes down to what data is already available and what's practical for the method being validated.
A Worked Example
Say a calibration curve gives a slope of S = 100 (peak-area units per µg/mL), and the estimated standard deviation of the response is σ = 2.
LOD = (3.3 × 2) / 100 = 6.6 / 100 = 0.066 µg/mL
The method should be able to detect the analyte down to roughly this concentration — though at that level, don't expect it to also measure the exact amount reliably. That's what the LOQ calculation (10σ/S) is for.
Why This Isn't Just an Exam Topic
In a real quality-control lab, LOD matters because pharmaceutical products are routinely screened for very low levels of impurities, degradation products, or residual solvents. Before a method can be trusted to declare "this impurity is below the acceptable limit," someone has to demonstrate the method is actually capable of detecting the impurity at that low a level in the first place. A method with a poor (too-high) LOD simply isn't fit for that job, no matter how well it performs otherwise.
Where Students Usually Slip Up
- Treating LOD as a measurement, not just a detection. An analyte can be "detected" at the LOD without being accurately quantified — that's the whole reason a separate LOQ exists.
- Forgetting there are three valid approaches. An exam answer that mentions the 3.3σ/S formula and skips visual evaluation and signal-to-noise is incomplete.
- Mixing up the constants. 3.3 is for LOD; 10 is for LOQ. Easy to swap under exam pressure.
- Not knowing where σ comes from. Students often memorise the formula but can't explain that σ can come from blank measurements or from calibration-curve residuals — this is usually where marks are lost in viva or long-answer questions.
One-Line Answer for Exams
If you remember sentence, make it this one: The Limit of Detection can be determined by visual evaluation, by the signal-to-noise ratio (for methods with baseline noise), or by calculation using LOD = 3.3σ/S, where σ is the standard deviation of the response and S is the slope of the calibration curve.
References
- International Council for Harmonisation (ICH), ICH Q2(R2): Validation of Analytical Procedures
- United States Pharmacopeia, General Chapter <1225> Validation of Compendial Procedures
- United States Pharmacopeia, General Chapter <1210> Statistical Tools for Procedure Validation
Related reading
If this article on Limit of Detection (LOD): Method of Determination Explained Simply was helpful, explore these related guides for more practical information on similar topics.
- Shock: Types, Causes, Pathophysiology and Stages Explained — Shock: Types, Causes, Pathophysiology and Stages Explained (Complete Pharm D Notes) Introduction Shock is of the most important topic…
- HPLC Method Validation in Pharmaceutical Analysis — ICH-aligned validation parameters for assay and impurity methods in QC laboratories.
- Understanding Drug–Drug Interactions in Clinical Pharmacy Practice — A practical overview of clinically significant interactions.
- Plant-Derived Alkaloids: Is Kratom Itself an Alkaloid? — From isolation to therapeutic application — a structured review for pharmacy curricula.
- Medication Therapy Management in Community Practice — How structured MTM visits improve outcomes and expand the pharmacist's clinical role.
- Adverse Drug Reaction Reporting Systems — Pharmacovigilance fundamentals for students and practicing pharmacists.